Marketplace›Web and tech›Data and analytics›Watershed climate sensitivity diagnosis using the SRF-SEI framework
Watershed climate sensitivity diagnosis using the SRF-SEI framework

Watershed climate sensitivity diagnosis using the SRF-SEI framework

Data and analytics · delivered in 3-7 days

What you get

PBN.LTD offers a fast, data-led diagnosis of how mountain watersheds respond to warming, built on our own SRF-SEI anchoring framework. The method has been checked against 78 watershed records in the western United States and 14406 grid points across Chinese mountain ranges, with results delivered in as little as 5 business days.

  • Single Watershed Quick Diagnosis ($18.99, 3-day delivery) - a 2-page PDF screening report covering SRF snow-reliance scoring, SEI warming-trend read-out, anchor-type classification, a straightforward sensitivity verdict and 1 round of revision.
  • Single Watershed Full Diagnosis ($100.99, 5-day delivery) - a 5 to 10-page report adding 30 to 60-year SEI trend analysis, snow-depth trend and snowmelt-peak variation, system-state transition risk assessment, time-series charts, bilingual English/Chinese formatting and 3 rounds of revision.
  • Batch Watershed Screening (10+ watersheds, $250.99, 7-day delivery) - unified SRF and SEI calculation across as many as 10 watersheds per order, batch anchor-type classification, a warming-sensitivity ranking, flagging of higher-risk watersheds, a consolidated summary report and 2 rounds of revision.

Every order needs the domain the order relates to and a short brief from you describing the watershed or region in question.

What we do

PBN.LTD provides a swift assessment of how mountain watersheds are likely to react to a warming climate. Our SRF-SEI anchoring framework looks at watershed sensitivity to heat and flags whether a catchment is nearing what we call an anchor switch, a shift in its seasonal flow behaviour.

Conventional hydrology tends to ask where the water originates. Our approach instead considers how the seasonal pattern of flow within a watershed is set to shift as temperatures rise.

What the report covers

  • Anchor type diagnosis: snow anchor, mixed anchor, rain anchor or hidden anchor
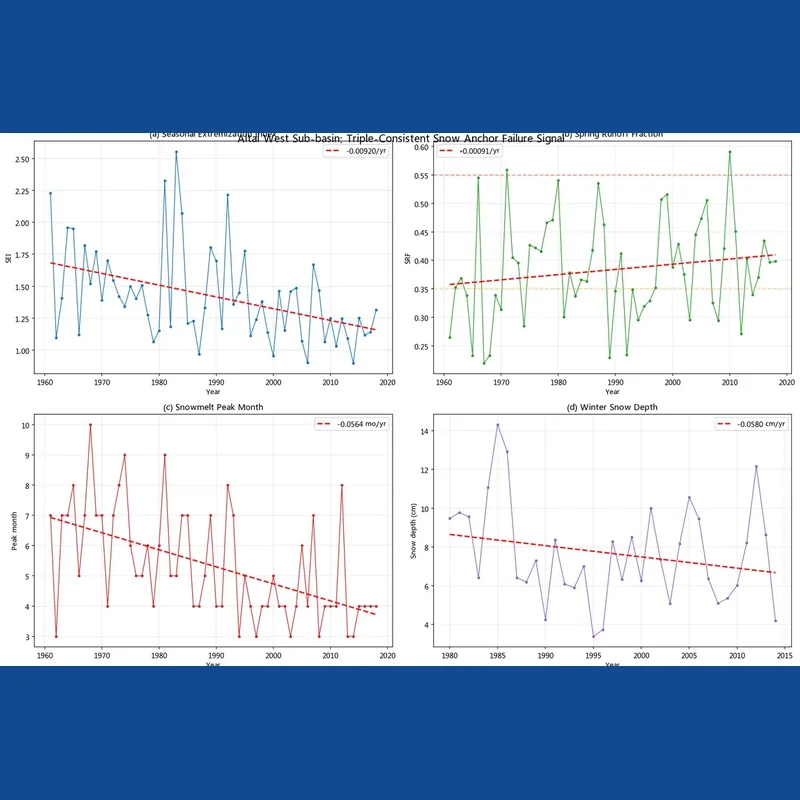
  • SRF (Spring Runoff Fraction): the share of yearly runoff arriving between April and June, a gauge of snow dependence
  • SEI (Seasonal Extremization Index): mean July to September flow set against the annual median flow
  • A look back at SEI patterns across the past 30 to 60 years
  • Winter snow-depth trends over the preceding 30 to 40 years
  • Trends in the timing of the snowmelt peak
  • A plain-language verdict with practical recommendations
  • A 5 to 10-page diagnostic report complete with time-series charts

Who this suits

  • Consultancies needing quick, batch-level screening of watersheds ahead of project appraisal
  • Planning bodies carrying out preliminary regional water-security studies
  • Research groups examining watershed response patterns
  • Water authorities wanting an internal research reference point

Case comparison

Two watersheds with almost identical SRF values, 0.384 against 0.377, can still show markedly different system sensitivities, a distinction that conventional source-partitioning methods miss but our framework picks up.

Method background

The framework is grounded in Ou's 2024 EarthArXiv preprint, which explores how snow dependence shapes warming-driven seasonal extremization within mountain watershed systems. Testing has covered 78 watersheds across the western United States and 14406 grid points in Chinese mountain regions, with out-of-sample prediction reaching a correlation of -0.405 at a significance level of 0.014.

How it works

  1. You supply the watershed's coordinate range or a USGS station ID
  2. We pull streamflow, snow-depth and climate figures from public datasets
  3. We compute SRF, SEI, the snowmelt peak date and winter snow depth
  4. We assign the anchor type and sensitivity level
  5. We hand over a PDF diagnostic report

Turnaround

Delivery within 5 business days.

A note on scope

This service is intended for academic and research reference only. It does not amount to a legally valid hydrological survey or water-resource assessment, and should not be used for engineering approval, water-resource argumentation or final insurance pricing. Findings should be checked against local field observations.

Why choose PBN.LTD

We can screen a large number of watersheds within a week and highlight the fraction needing closer study, working faster than traditional hydrological methods. Rather than asking how much snow water exists, we ask how the system is likely to behave as warming continues. We see this as complementary to detailed hydrological modelling rather than a replacement for it.

What happens after you buy

Your order opens its own thread here the moment it is paid, and everything about that order - questions, changes and the final report - happens in it.
Questions people ask

How long does delivery take?

Turnaround varies by package: the Single Watershed Quick Diagnosis takes 3 business days, the Single Watershed Full Diagnosis takes 5 business days, and the Batch Watershed Screening (10+ watersheds) takes 10 business days. A faster option, cutting 2 days from the schedule, can be added for $30.

What do I need to provide to start?

To begin, please share: 1. the watershed's coordinate range or a USGS station ID; 2. confirmation that the report is for internal research use only; 3. your preferred format, either PDF alone or PDF plus Excel. If you lack exact coordinates, simply tell us the watershed's name and rough location and we will set the boundary and check it with you before starting work.

Can I use this report for regulatory approval or engineering projects?

No. The report is meant for academic and research reference only and does not carry the standing of a legally valid hydrological survey or water-resource assessment. It should not be used for administrative approval, engineering initiation, water-resource argumentation or final insurance pricing. For a legally valid report, please consult a licensed hydrological survey body.

What data do you use?

We draw solely on public datasets, including the CNRD v1.0 Natural Runoff Dataset from the National Tibetan Plateau Data Center, the China Long-Term Snow Depth Dataset, NASA POWER, and the USGS National Water Information System. These are model-simulated or reanalysis-based gridded records rather than field measurements, which suits pre-screening and sensitivity ranking, though final decisions should be checked against local observations.

What if I'm not satisfied with the result?

If the delivered report does not meet your expectations, reach out within 7 days and we will amend it based on your feedback at no additional charge. Where the concern relates to interpretation or methodology, we will walk through our reasoning and add further context. Refund requests are reviewed individually, and since this is a bespoke analysis service, a refund is not guaranteed once the report has been delivered.

Can you analyze a watershed outside China or the United States?

Our data coverage is centred on China, through the CNRD and snow-depth datasets, and the United States, through USGS NWIS. For watersheds elsewhere, NASA POWER climate data can be used, though we would first need to check whether streamflow and snow-depth records are available. Please message us with the watershed's location before ordering so we can confirm whether a meaningful diagnosis is possible.

People also buy

Data and analytics

Data analysis using Excel, SQL, and Power BI

We clean, analyse and visualise your business data using Excel, SQL and Power BI, delivering clear dashboards and actionable reports within 3 days.

$25.99 - $50.99PACKAGES FROM 3 days