What is included
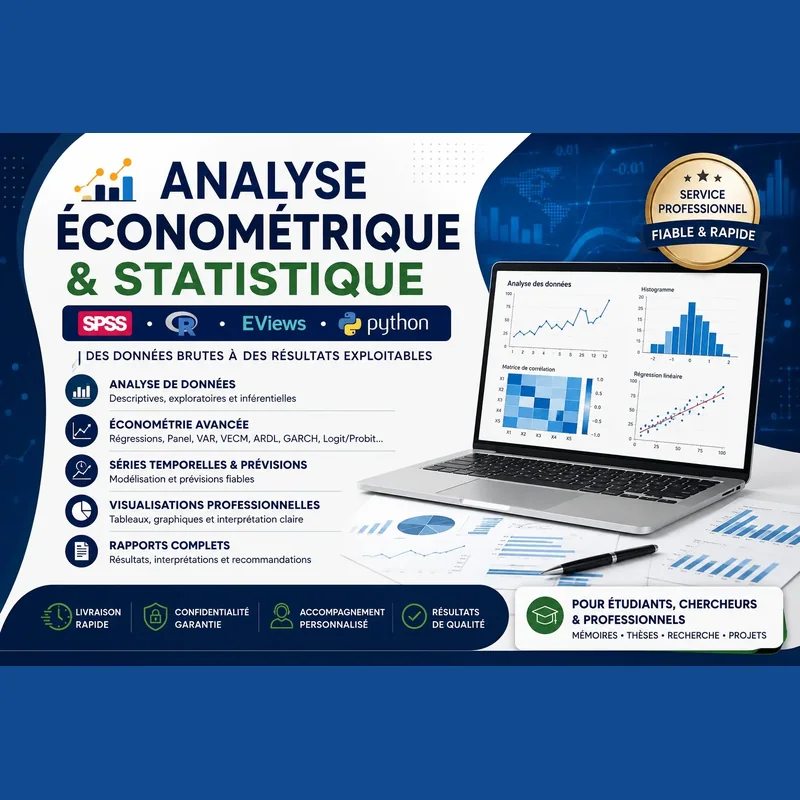
Every package covers careful statistical and econometric work using SPSS, R, EViews and Python, with output tailored to the depth of analysis required.
- Basic - price 37.99 USD, delivery in 2 days: straightforward statistical analysis (descriptive statistics, normality tests, correlations, tables and charts) with written interpretation, plus 1 revision.
- Standard - price 62.99 USD, delivery in 3 days: fuller statistical analysis (regression, ANOVA, hypothesis testing, visualisations and detailed interpretation) carried out in SPSS, R, EViews or Python, plus 2 revisions.
- Premium - price 125.99 USD, delivery in 5 days: advanced econometric modelling (panel data, VAR, VECM, ARDL, GARCH, Logit/Probit, time series and forecasting) with a full report, source code and recommendations, plus unlimited revisions.
To start, please provide the domain this order is for and a brief describing your project.
Econometric and statistical analysis with SPSS, R, EViews and Python
This listing gives more than 300 words on how we turn your dataset into results you can actually use, whether the work is for a dissertation, a thesis, a scientific paper, a professional assignment or a market study. The aim throughout is to produce output that is clear, correctly interpreted and ready to support your conclusions.
Areas covered
- Descriptive and exploratory analysis of your data
- Cleaning and preparing databases
- Statistical testing: normality, correlation, comparison between groups
- Simple and multiple regression
- Econometric modelling: OLS, Logit, Probit, panel data, VAR, VECM, ARDL, GARCH and similar techniques
- Time series work and forecasting
- Multivariate methods such as PCA, MCA, classification and clustering
- Graphs and visual presentation of data
- Thorough interpretation of findings
- Reporting that follows academic conventions
What you receive
- A structured file containing the results
- The underlying scripts or code, in SPSS, R, Python or EViews as needed
- A detailed explanation of what the analysis shows
- Tables and graphics presented to a professional standard
- Recommendations shaped around your particular study
- Revisions where required, according to the package chosen
How the work proceeds
- We review your goals and requirements.
- Your data is checked and prepared.
- The statistical or econometric analysis is carried out.
- Results are interpreted and explained clearly.
- The finished work is delivered within the agreed timeframe.
Who this suits
We bring solid grounding in statistics, econometrics and data analysis, comfortable across SPSS, R, EViews and Python, and we keep communication prompt and work confidential. This makes the service a good fit for learners, academic researchers, businesses and other professionals who need dependable numerical analysis. Before ordering, feel free to get in touch so we can shape the approach around your project and budget.
What happens after you buy
Your order opens its own thread here the moment it is paid, and everything about that
order - questions, changes and the final report - happens in it.