What is included
- Basic - $100.99, delivered in 3 days: 1 single-channel file analysed, an anchor score from 0 to 1, peak frequencies (f1, f2), a PDF analysis report, 1 round of follow-up questions and 1 revision.
- Pro - $500.99, delivered in 5 days: up to 10 files analysed with an anchor score and peak frequencies (f1, f2) for each, a cross-file comparison table, a PDF report with summary statistics, 2 rounds of follow-up questions and 2 revisions.
- Enterprise - $1875.99, delivered in 10 days: 30 or more files or a continuous time series, an anchor score per file or window, custom frequency band settings, batch comparison with trend detection, output in JSON, CSV or Excel, delivery as JSON, CSV or PDF, 3 rounds of follow-up questions, 3 revisions and an optional ongoing monitoring subscription.
You will need to provide the domain the order relates to and a brief describing your dataset and goals.
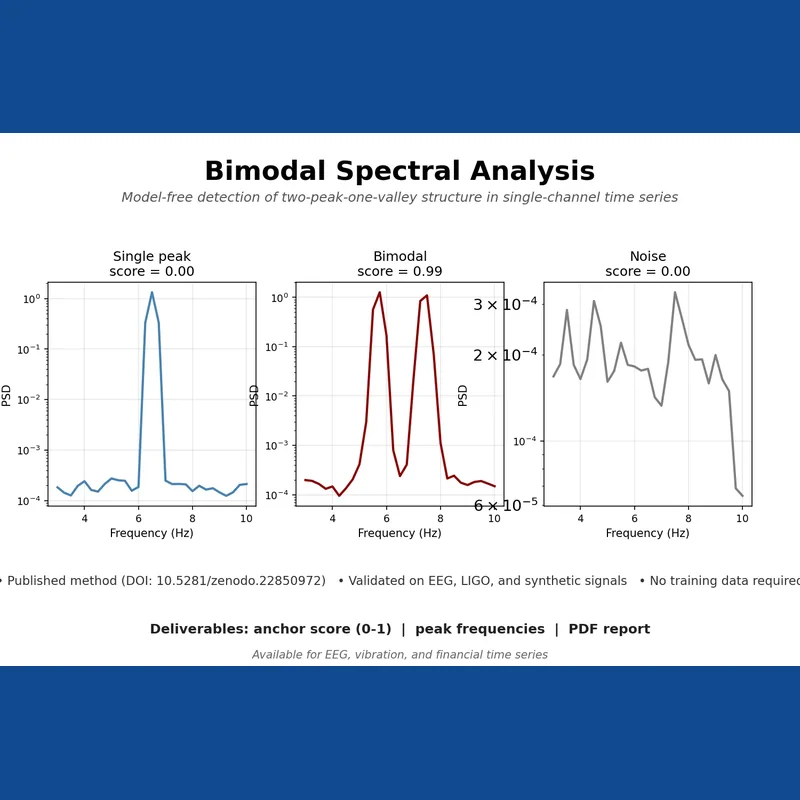
Bimodal spectral analysis for single-channel data
We look for twin frequency peaks separated by a valley inside your continuous single-channel measurement data. The underlying algorithm and its parameter settings remain our own intellectual property; only the analysis results are handed over, not source code or tuning details.
What you receive
An anchor score between 0 and 1 showing how strongly the twin-peak pattern is present, the two peak frequencies (f1, f2) in Hz, and a complete PDF report. Batch analysis across several files is available as an option.
Testing behind the method
The approach has been checked against synthetic signals with known structure, gravitational-wave detector recordings, and a 24-subject meditation EEG dataset (OpenNeuro ds001787). Repeated checks across different parameters, frequency bands, window lengths and channel subsets showed consistent results.
What we need from you
A single-column CSV file of your data, its sampling rate in Hz, the domain the order is for, and your brief. An automatic scan covers the full dataset, so you do not need to define a frequency band in advance.
Turnaround
A single file is typically analysed within 24 hours; batch runs covering 10 or more files take 3 to 5 business days, and larger enterprise jobs can take up to 10 days.
Where this is useful
EEG and neuroscience work such as sleep, anaesthesia or meditation research, mechanical vibration and fault monitoring, cycle analysis in finance and economics, and any single-channel dataset where two frequency components carry meaningful information.
Reference pricing
A single-file analysis starts at $80, batch analysis of 10 or more files starts from $600, and long-term monitoring arrangements are quoted individually. You can reach us via ORCID 0009-0008-4540-1381.
Notes on use
Findings are supplied for research and reference purposes only, not as medical, financial or investment advice. Uploaded data is used solely for your analysis and is permanently deleted within 7 days of delivery, never shared or reused elsewhere. Results may be cited in publications.
What happens after you buy
Your order opens its own thread here the moment it is paid, and everything about that
order - questions, changes and the final report - happens in it.