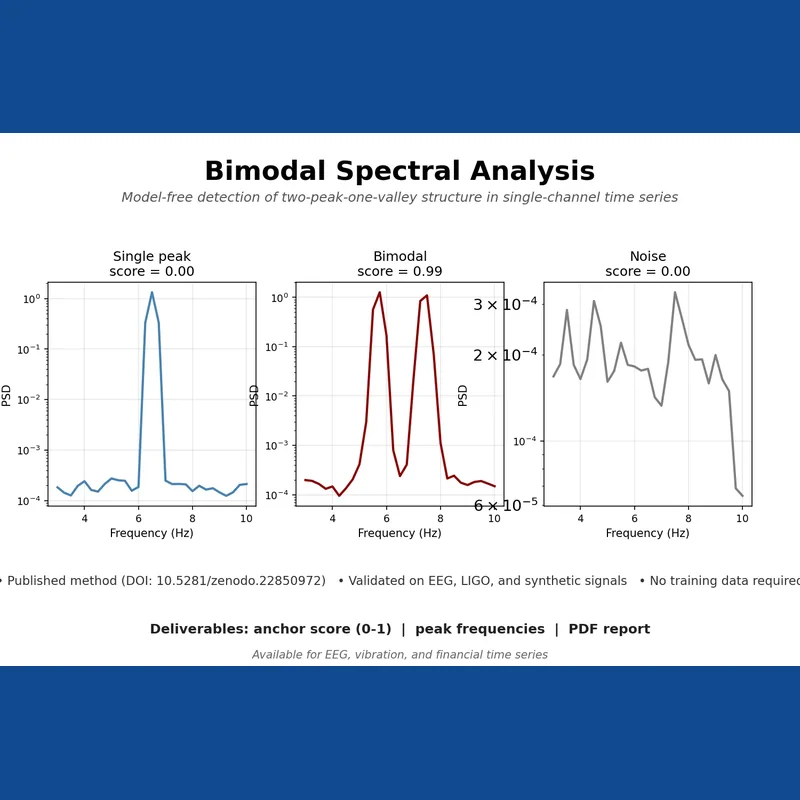
What you receive
- Basic Diagnosis (5-day delivery): a single-dataset diagnostic report with automated frequency band scanning, five-class classification, transition detection, a 3-panel visualisation, a CSV results table, 1 round of questions and answers and 1 revision.
- Standard Diagnosis (7-day delivery): everything in Basic, covering up to 3 datasets, plus cross-dataset structural comparison, transition timestamp comparison, up to 2 Q&A; rounds and 2 revisions.
- Advanced Diagnosis (10-day delivery): everything in Standard, scaled to batch processing of up to 10 datasets, with an extended analysis report, up to 3 Q&A; rounds and 3 revisions.
You supply the domain the order relates to and a short brief describing what you want examined.
Time-series structure diagnostics
We examine your continuous, single-channel measurement data to determine which frequency bands hold genuine structure, classify each of those bands, and mark the exact point where system behaviour changes. Rather than simply showing how much power sits at each frequency, our report describes what kind of structure is present and when it shifted.
The method is described in a published preprint (DOI: 10.5281/zenodo.22837806).
What is not included
We do not release the underlying algorithm code, exact parameter values, or tuning and implementation details. The core method and its settings remain our own intellectual property; you receive the analysis output only.
Where it has been tested
The approach has been checked against synthetic signals with known structure, LIGO gravitational-wave detector data, and real-world continuous measurements drawn from several fields.
Where it can be applied
Potential uses include EEG and neuroscience work such as sleep staging or anaesthesia monitoring, mechanical vibration and equipment fault monitoring, finance and economics cycle or regime-shift analysis, and environmental records such as climate, hydrology or seismic data. In general, any single-channel continuous dataset whose behaviour may change over time is suitable.
What we need from you
Please provide your data file (CSV, TXT or HDF5), the sampling rate, and a short note describing what you are trying to find.
Turnaround
A single file is typically returned within 24 hours; a batch of 10 or more files takes 3 to 5 business days.
Data handling
Your uploaded data is used solely for your requested analysis. Source data is permanently deleted within 7 days of delivery and is never shared or reused for any other purpose.
What happens after you buy
Your order opens its own thread here the moment it is paid, and everything about that
order - questions, changes and the final report - happens in it.