Data and analytics
3-page PDF to editable Excel or CSV table conversion
Convert up to three PDF pages into a tidy, editable Excel or CSV table, delivered within 24 hours.
$12.99PER ORDER
1 day

Data and analytics · delivered in 1 day · Quick service
PBN.LTD takes your disorganised spreadsheet, up to 200 rows, and converts it into a tidy, consistent file that is simple to read, sort and filter. We strip out duplicate entries, straighten column headings, line up data in the correct columns, correct stray spacing or formatting issues, and bring dates, numbers and text into a uniform style throughout.
Gaps or misplaced entries are spotted and dealt with sensibly, and we preserve your original data as closely as possible so no important detail is lost in the process.
This service works well for lists pulled from other platforms, spreadsheets that have grown messy over time, customer or stock records, survey data, and any file made awkward by duplicates, blank lines or inconsistent entries.
The finished file comes back in both XLSX and CSV formats, ready to open directly in Excel, Google Sheets or similar programs without extra tidying on your end.
Let us know which columns matter most, whether certain values must stay untouched, and how you would like dates or currency displayed. We use AI tools to speed up repetitive steps, but every file is manually checked, formatted and adjusted before it reaches you, including a final pass to confirm row counts look correct and headings match the data.
Turnaround is within 24 hours of receiving your spreadsheet and instructions, and one round of minor corrections is included if a column, heading or format needs adjusting afterwards.
Your order opens its own thread here the moment it is paid, and everything about that order - questions, changes and the final report - happens in it.
Convert up to three PDF pages into a tidy, editable Excel or CSV table, delivered within 24 hours.
Careful data entry, Excel formatting and PDF conversion delivered accurately and on schedule for businesses, students and online projects.
Professional, fully manual data entry and Excel support with fast turnaround, covering typing, conversions, formatting and cleaning across three service tiers.
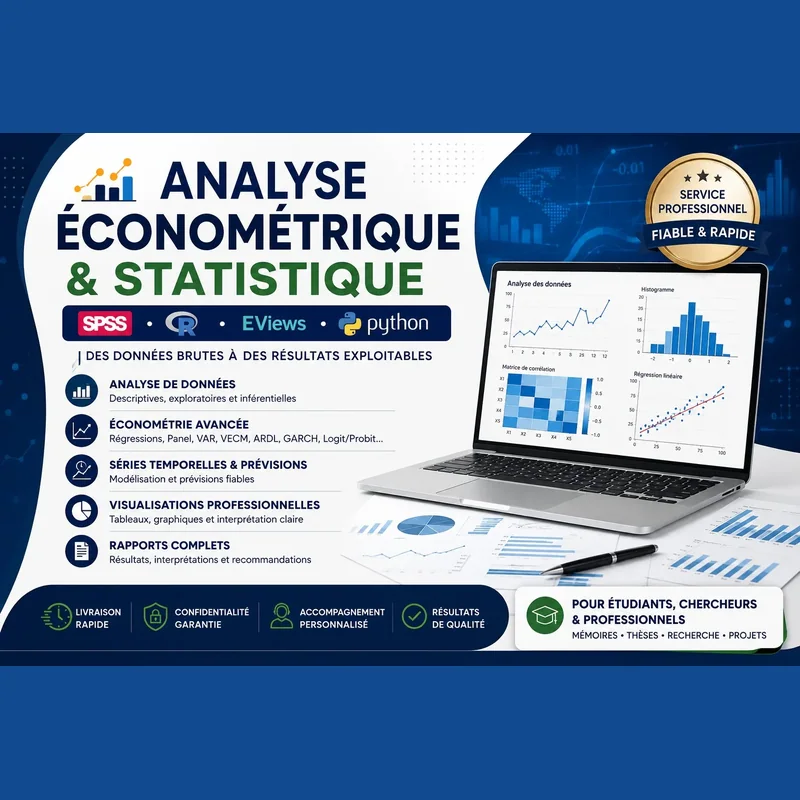
Rigorous statistical and econometric analysis using SPSS, R, EViews and Python, turning raw data into clear, actionable results for academic and business projects.
A single Streamlit risk gauge built in Python that turns one operational metric into a clear, colour-coded status view for your business.
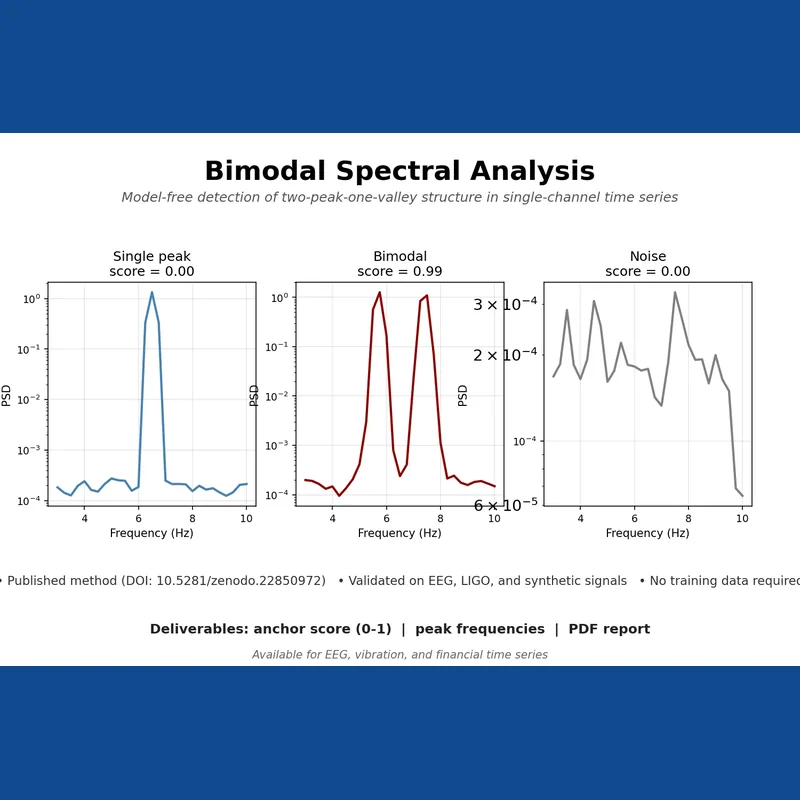
We analyse continuous single-channel time series data to detect twin-peak frequency structures, delivering a quantified anchor score (0-1), peak frequencies (f1, f2) and a full PDF report.