What you receive
Basic package
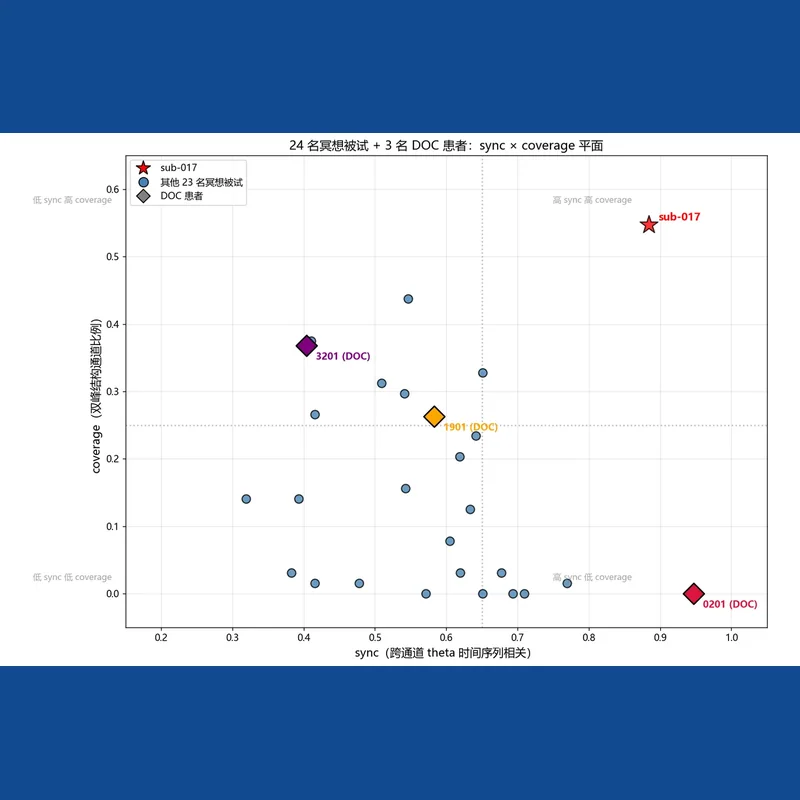
- One EEG recording plotted on the sync by coverage plane
- Background reference clouds drawn from 111 previously published subjects
- A one-page written interpretation (PDF)
- All figures supplied as PNG files
- A CSV file listing your per-subject sync and coverage coordinates
- 1 revision
Standard package
- Everything from the Basic tier
- A time-resolved synchrony curve
- A time-resolved coverage curve
- A time-resolved theta curve
- A full 2-page written report (PDF)
- CSV export of per-subject sync and coverage values
- 2 revisions
The underlying method is described in a framework we published on Zenodo (DOI: 10.5281/zenodo.23103048), which plots brain activity across two dimensions rather than one.
Mapping brain states on two axes
This service places your EEG recording on a two-dimensional plane defined by synchrony and coverage, a method we published on Zenodo. Standard synchrony measures such as coherence, PLV, wPLI or AEC only capture how strongly regions oscillate together, which means two very different brain states can produce the same high synchrony reading.
Why a second dimension matters
- Functional whole-brain coordination — seen during meditation or focused conscious activity
- Pathological high synchrony — seen in epileptic discharges, burst-suppression or disorders of consciousness
Adding coverage as a second axis lets us tell these two patterns apart, reducing ambiguity in consciousness research, EEG connectivity work and neurodynamic studies.
Who this suits
- Consciousness and meditation EEG research
- Disorders of consciousness, including vegetative and minimally conscious states
- Anesthesia-related brain state transitions
- General neurophysiology and brain dynamics work
- EEG connectivity, coherence and synchrony analysis
- EEG time-series and oscillation studies
- Neuroimaging research in academic settings
What you get
A scatter plot showing where your data sits on the sync by coverage plane, positioned against a background cloud built from 111 published subjects across meditation, disorders-of-consciousness and anaesthesia datasets. You also receive a written interpretation of which pattern your recording resembles, plus all figures as high-resolution PNG files.
Data requirements
- File format: EDF, BDF or BrainVision
- Sampling rate of at least 100 Hz
- Minimum recording length: 5 minutes
- Minimum of 16 channels
Turnaround is 5 business days for the Basic tier. If you are uncertain whether your dataset qualifies, message us before ordering.
Scope and limits
This service is intended for academic research only and is not a clinical diagnostic tool. We do not supply source code, calculation scripts or algorithm parameters. You must hold full legal rights to any uploaded EEG dataset, and raw recordings are not kept permanently after delivery.
What happens after you buy
Your order opens its own thread here the moment it is paid, and everything about that
order - questions, changes and the final report - happens in it.